Drawing#
Tools to visualize topologies of D-Wave QPUs and weighted graph problems on them.
Chimera Graph Functions#
Tools to visualize Chimera lattices and weighted graph problems on them.
|
Positions the nodes of graph |
|
Generates a function that converts Chimera indices to x- and y-coordinates for a plot. |
|
Draws graph |
|
Draws an embedding onto the Chimera graph |
|
Draws graph |
Example#
This example uses the chimera_layout() function to show the positions
of nodes of a simple 5-node NetworkX graph in a Chimera lattice. It then uses the
chimera_graph() and draw_chimera() functions to display those
positions on a Chimera unit cell.
>>> import networkx as nx
>>> import dwave_networkx as dnx
>>> import matplotlib.pyplot as plt
>>> H = nx.Graph()
>>> H.add_nodes_from([0, 4, 5, 6, 7])
>>> H.add_edges_from([(0, 4), (0, 5), (0, 6), (0, 7)])
>>> pos=dnx.chimera_layout(H)
>>> pos
{0: array([ 0. , -0.5]),
 4: array([ 0.5,  0. ]),
 5: array([ 0.5 , -0.25]),
 6: array([ 0.5 , -0.75]),
 7: array([ 0.5, -1. ])}
>>> # Show graph H on a Chimera unit cell
>>> f, axes = plt.subplots(1, 1)
>>> G=dnx.chimera_graph(1, 1, 4)  # Draw a Chimera unit cell
>>> dnx.draw_chimera(G, node_color='r', ax=axes)
>>> dnx.draw_chimera(H, node_color='b', node_shape='*', style='dashed', edge_color='b', width=3, ax=axes)
>>> plt.show()
>>> # matplotlib commands to add labels to graphic not shown
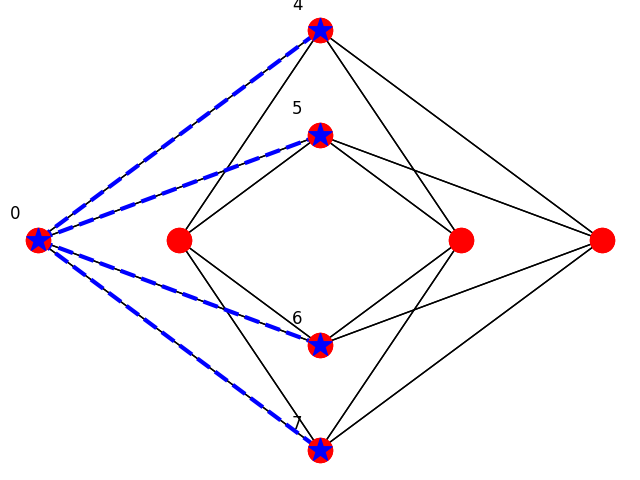
Graph H (blue) overlaid on a Chimera unit cell (red nodes and black edges),
which is rendered in a cross layout.#
Pegasus Graph Functions#
Tools to visualize Pegasus lattices and weighted graph problems on them.
|
Draws graph |
|
Draws an embedding onto Pegasus graph |
|
Draws graph |
|
Positions the nodes of graph |
|
Generates a function to convert Pegasus indices to plottable coordinates. |
Example#
This example uses the draw_pegasus() function to show the positions
of nodes of a simple 5-node graph on a small Pegasus lattice.
>>> import dwave_networkx as dnx
>>> import matplotlib.pyplot as plt
>>> G = dnx.pegasus_graph(2)
>>> H = dnx.pegasus_graph(2, node_list=[4, 40, 41, 42, 43],
              edge_list=[(4, 40), (4, 41), (4, 42), (4, 43)])
>>> # Show graph H on a small Pegasus lattice
>>> f, axes = plt.subplots(1, 1)
>>> dnx.draw_pegasus(G, with_labels=True, crosses=True, node_color="Yellow", ax=axes)
>>> dnx.draw_pegasus(H, crosses=True, node_color='b', style='dashed',
          edge_color='b', width=3, ax=axes)
>>> plt.show()
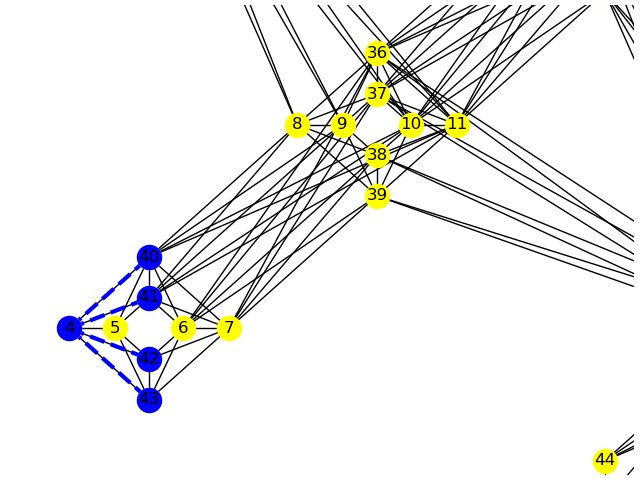
Graph H (blue) overlaid on a small Pegasus lattice (yellow nodes and black edges),
which is rendered in a cross layout.#
Zephyr Graph Functions#
Tools to visualize Zephyr lattices and weighted graph problems on them.
|
Draws graph |
|
Draws an embedding onto a Zephyr graph |
|
Draws graph |
|
Positions the nodes of graph |
|
Generates a function to convert Zephyr indices to plottable coordinates. |
Example#
This example uses the draw_zephyr_embedding() function to show the positions
of a five-node clique on a small Zephyr graph.
>>> import dwave_networkx as dnx
>>> import matplotlib.pyplot as plt
>>> import networkx as nx
...
>>> G = dnx.zephyr_graph(1)
>>> embedding = {"N1": [13, 44], "N2": [11], "N3": [41], "N4": [40], "N5": [9, 37]}
...
>>> plt.ion()
>>> dnx.draw_zephyr_embedding(G, embedding, show_labels=True)
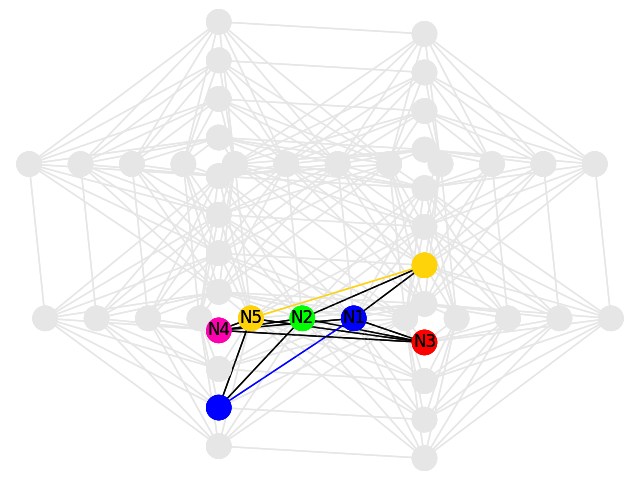
Five-node clique embedded in a small Zephyr graph.#